Financial Highlights
* Accounting Standard for Revenue Recognition and other standards applied as of the beginning of FY22/3.
Performance
Operating revenue
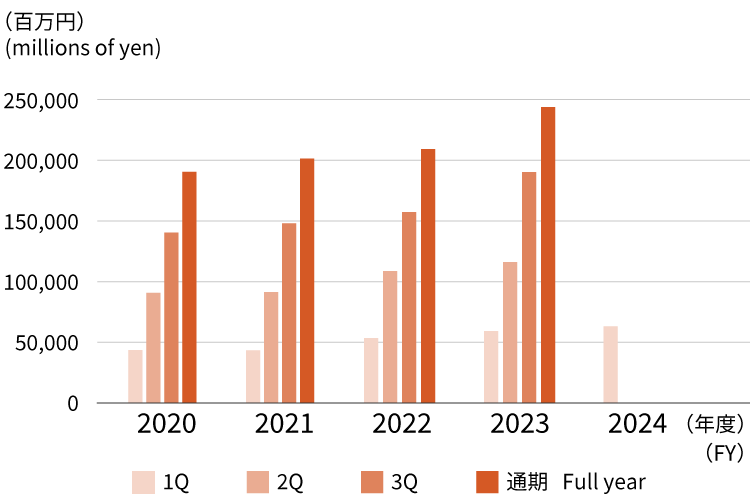
| FY2020 | FY2021 | FY2022 | FY2023 | FY2024 | |
| Full Year | 190,813 | 201,793 | 221,280 | 241,594 | |
| 3Q | 140,841 | 148,357 | 163,788 | 184,089 | |
| 2Q | 90,970 | 91,614 | 108,240 | 117,672 | |
| 1Q | 43,793 | 43,658 | 51,842 | 54,845 | 59,722 |
Operating income
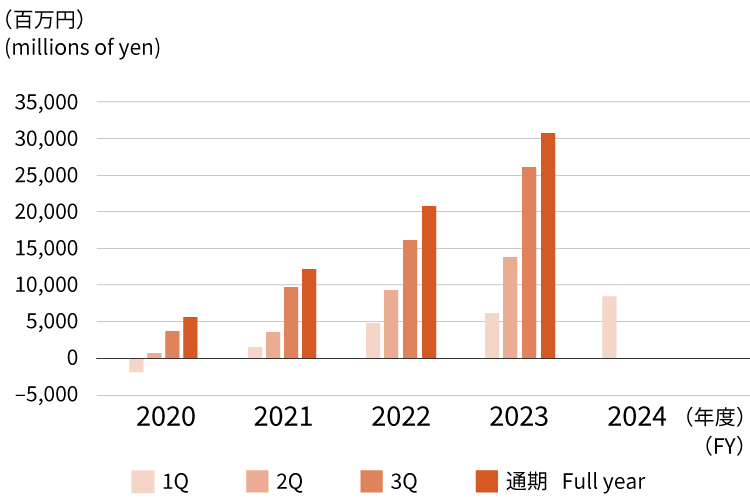
| FY2020 | FY2021 | FY2022 | FY2023 | FY2024 | |
| Full Year | 5,552 | 12,190 | 21,023 | 30,820 | |
| 3Q | 4,088 | 9,862 | 15,888 | 26,760 | |
| 2Q | 253 | 3,797 | 9,446 | 14,237 | |
| 1Q | -1,701 | 1,294 | 4,797 | 6,827 | 9,876 |
Ordinary income
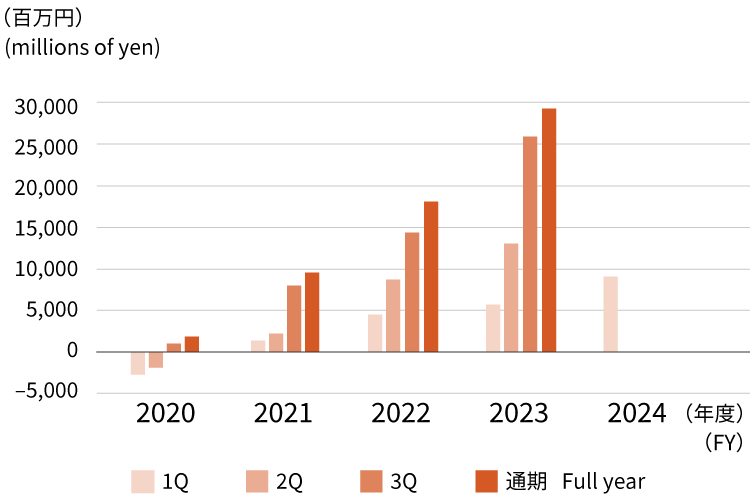
| FY2020 | FY2021 | FY2022 | FY2023 | FY2024 | |
| Full Year | 1,854 | 9,931 | 18,965 | 29,312 | |
| 3Q | 1,196 | 7,999 | 14,214 | 25,630 | |
| 2Q | -1,754 | 2,518 | 8,215 | 13,268 | |
| 1Q | -2,633 | 945 | 4,487 | 6,603 | 9,754 |
Profit attributable to owners of parent
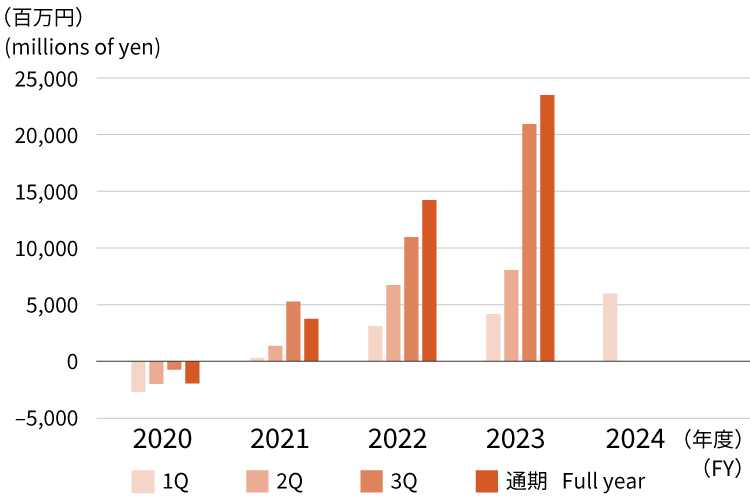
| FY2020 | FY2021 | FY2022 | FY2023 | FY2024 | |
| Full Year | -1,861 | 4,021 | 14,623 | 23,926 | |
| 3Q | -778 | 5,174 | 11,685 | 21,904 | |
| 2Q | -1,904 | 1,587 | 7,116 | 8,867 | |
| 1Q | -2,545 | 68 | 3,147 | 4,235 | 6,718 |
Financial Situation
Total assets
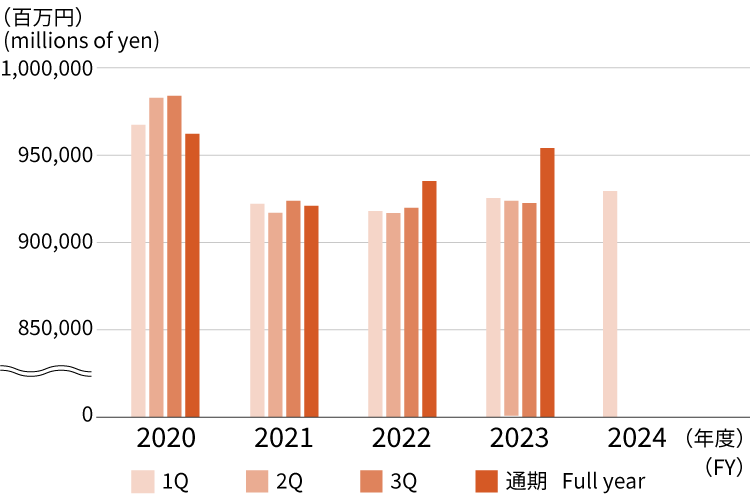
| FY2020 | FY2021 | FY2022 | FY2023 | FY2024 | |
| Full Year | 962,229 | 920,976 | 935,113 | 950,650 | |
| 3Q | 984,366 | 924,120 | 918,216 | 925,899 | |
| 2Q | 982,773 | 917,131 | 914,359 | 926,415 | |
| 1Q | 967,488 | 922,464 | 917,944 | 927,968 | 931,787 |
Net assets
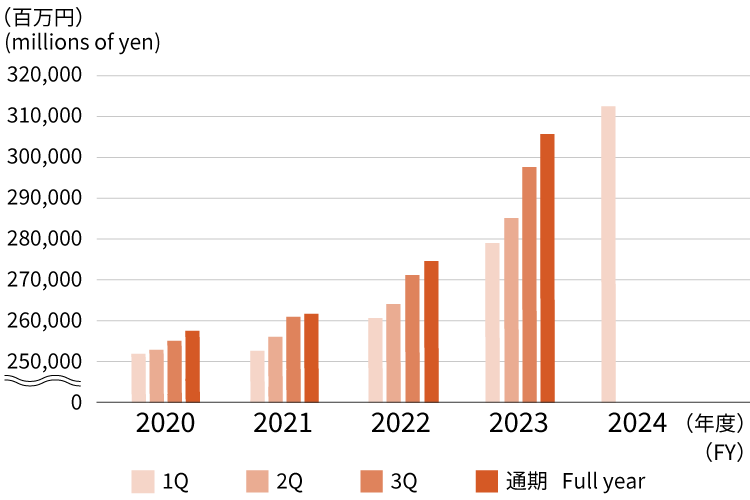
| FY2020 | FY2021 | FY2022 | FY2023 | FY2024 | |
| Full Year | 258,569 | 260,716 | 274,586 | 307,102 | |
| 3Q | 255,398 | 260,378 | 270,652 | 298,531 | |
| 2Q | 253,527 | 256,875 | 263,987 | 285,223 | |
| 1Q | 252,624 | 253,980 | 260,317 | 279,889 | 312,282 |
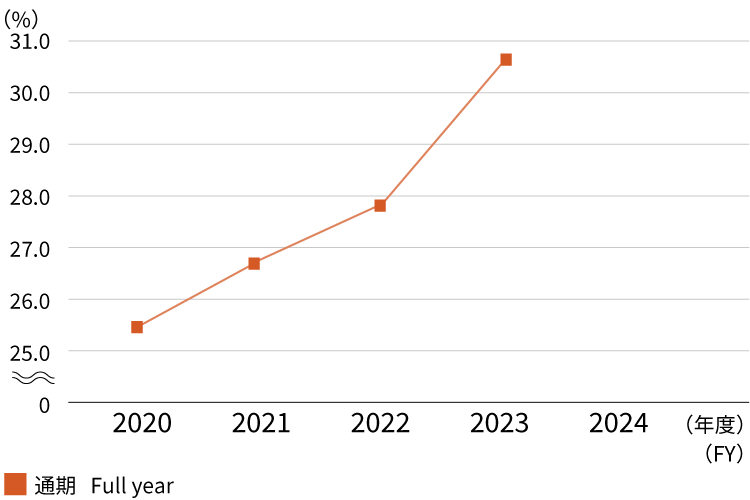
Equity ratio
|
FY2020 |
FY2021 |
FY2022 |
FY2023 |
FY2024 |
|
| Full Year | 25.6 | 26.9 | 27.9 | 30.8 |
Operating profit to operating revenue
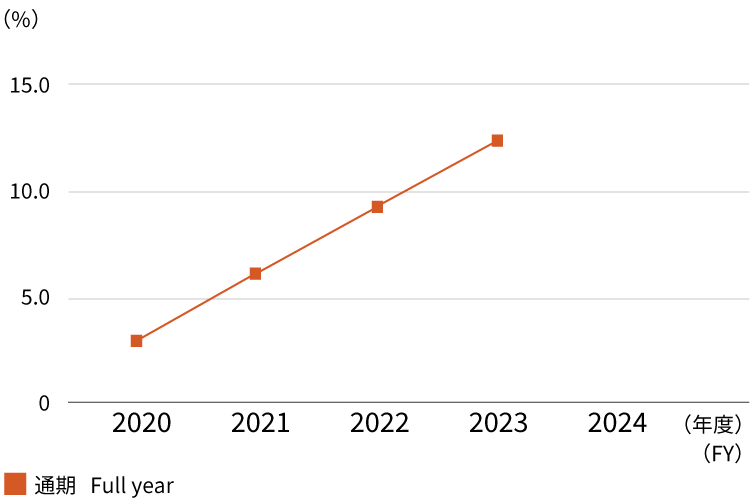
| FY2020 | FY2021 | FY2022 | FY2023 | FY2024 | |
| Full Year | 2.9 | 6.0 | 9.5 | 12.8 |
Return on assets (ROA)
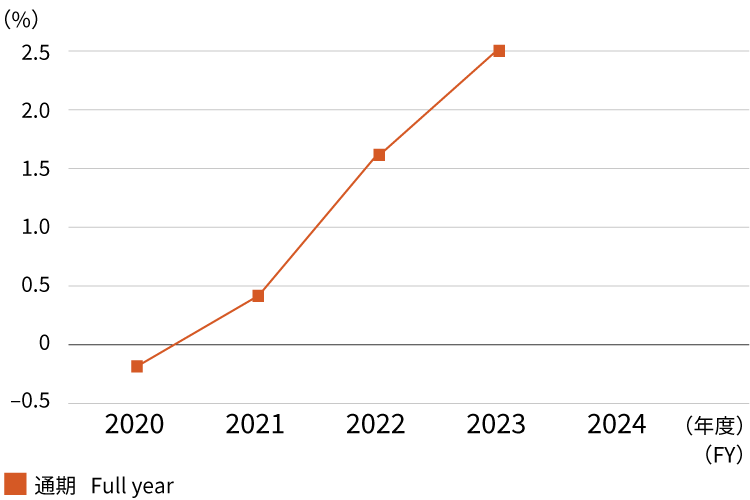
| FY2020 | FY2021 | FY2022 | FY2023 | FY2024 | |
| Full Year | -0.2 | 0.4 | 1.6 | 2.5 |
Return on equity (ROE)
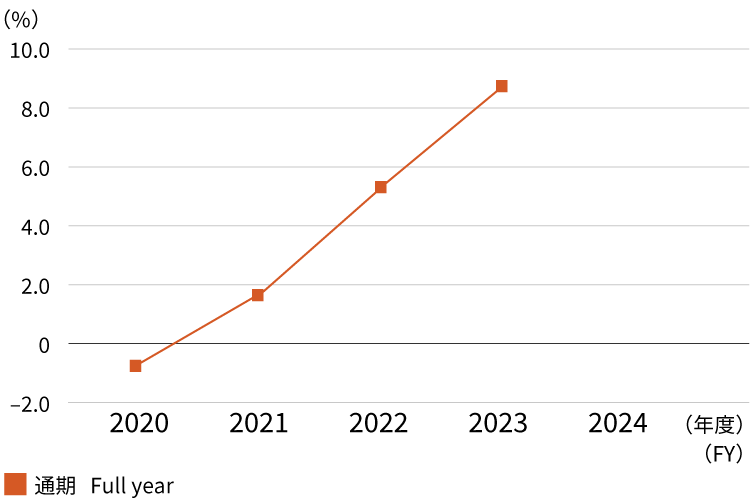
| FY2020 | FY2021 | FY2022 | FY2023 | FY2024 | |
| Full Year | -0.8 | 1.6 | 5.7 | 8.6 |
Interest-bearing debt/EBITDA ratio
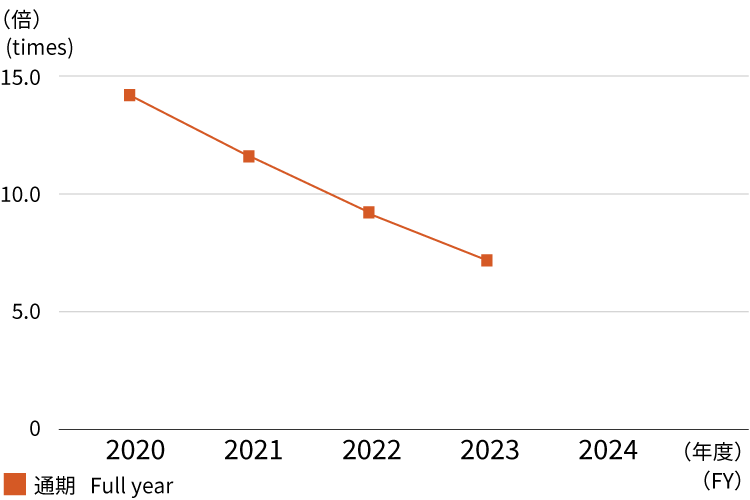
| FY2020 | FY2021 | FY2022 | FY2023 | FY2024 | |
| Full Year | 14.2 | 11.6 | 9.6 | 7.2 |
*EBITDA:
Operating Profit + Dividend Income + Depreciation and Amortization
Net interest-bearing debt/EBITDA ratio
| FY2020 | FY2021 | FY2022 | FY2023 | FY2024 | |
| Full Year | 13.0 | 10.7 | 8.8 | 6.5 |
*EBITDA:
Operating Profit + Dividend Income + Depreciation and Amortization
Investment
Capital investments
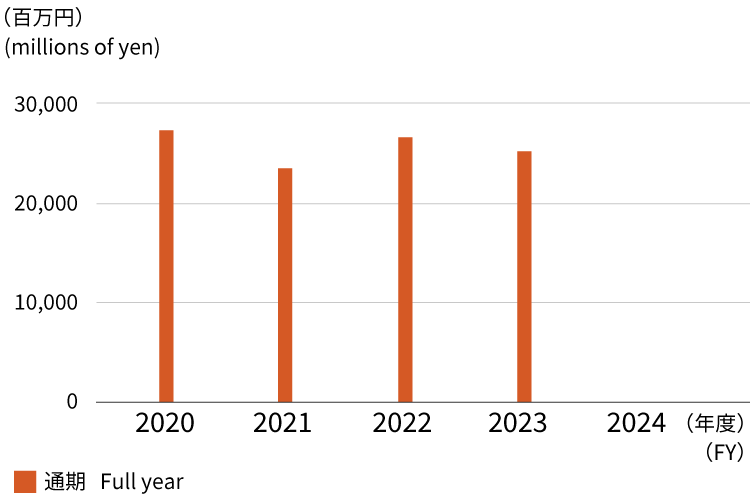
| FY2020 | FY2021 | FY2022 | FY2023 | FY2024 | |
| Full Year | 27,966 | 21,408 | 27,872 | 25,787 |
Depreciation and amortization
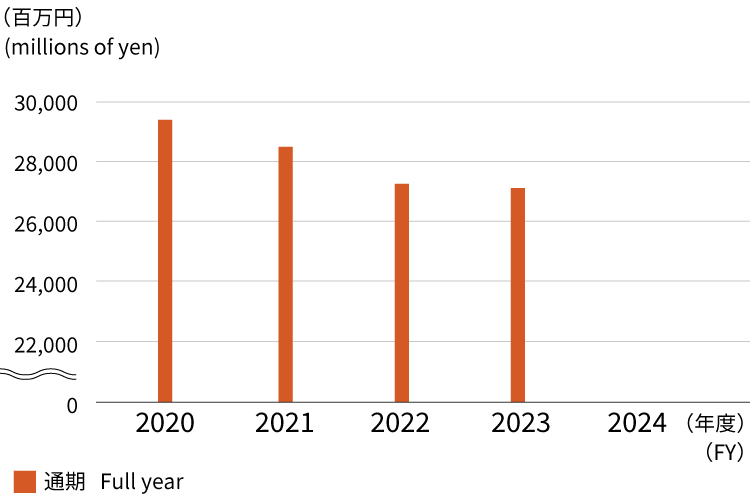
| FY2020 | FY2021 | FY2022 | FY2023 | FY2024 | |
| Full Year | 29,410 | 28,591 | 27,619 | 27,477 |
Cash Flows
Cash flows from operating activities
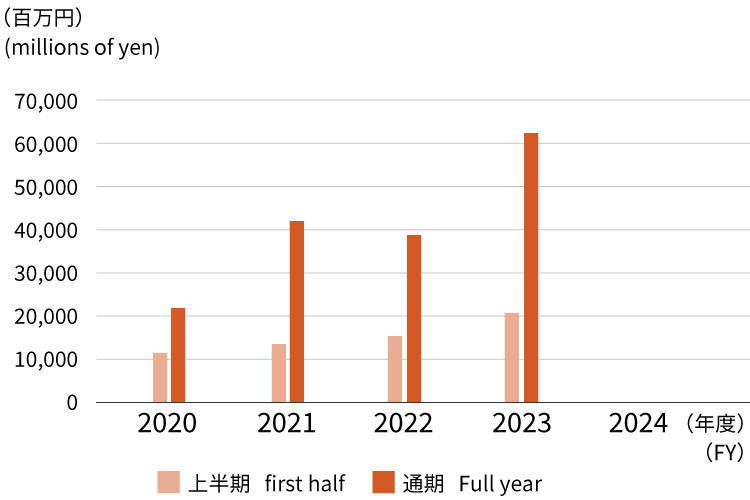
| FY2020 | FY2021 | FY2022 | FY2023 | FY2024 | |
| Full Year | 21,338 | 41,879 | 39,086 | 62,223 | |
| 2Q | 11,426 | 13,524 | 15,371 | 20,739 |
Cash flows from investing activities
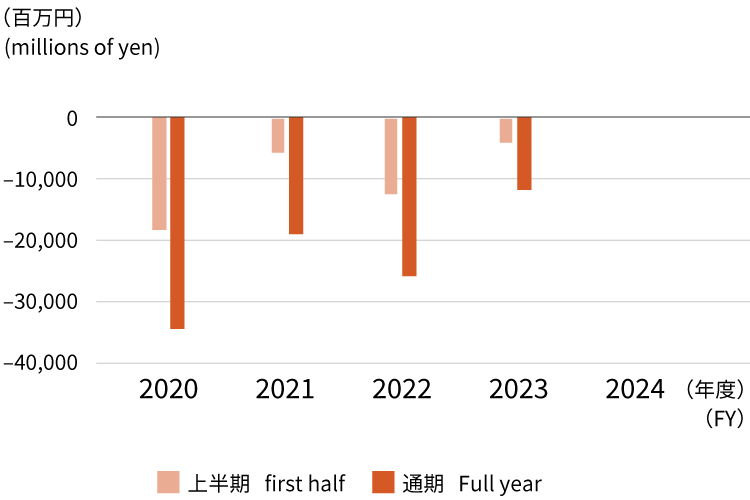
| FY2020 | FY2021 | FY2022 | FY2023 | FY2024 | |
| Full Year | -33,273 | -19,669 | -26,305 | -10,528 | |
| 2Q | -18,899 | -5,835 | -11,852 | -4,153 |
Cash flows from financing activities
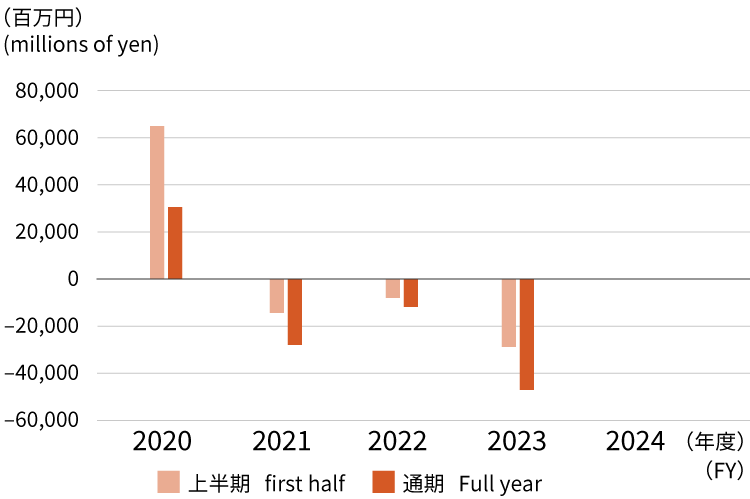
| FY2020 | FY2021 | FY2022 | FY2023 | FY2024 | |
| Full Year | 35,821 | -27,026 | -11,341 | -46,832 | |
| 2Q | 62,779 | -17,322 | -7,909 | -29,868 |
Per Share Information
Book value per share (BPS)
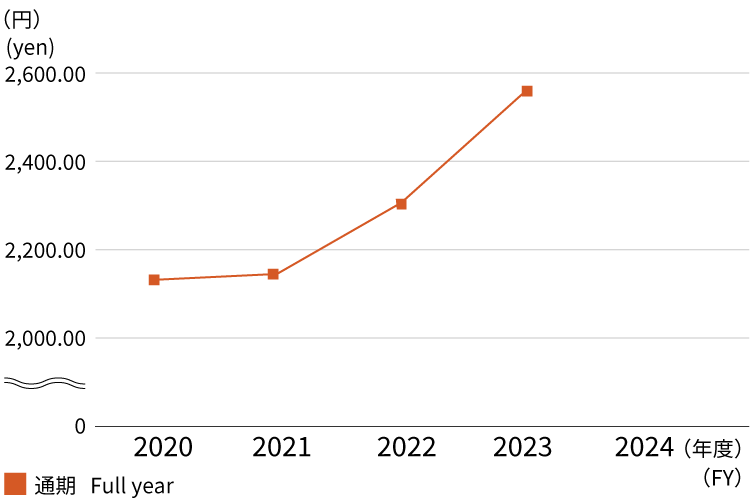
| FY2020 | FY2021 | FY2022 | FY2023 | FY2024 | |
| Full Year | 2,176.19 | 2,189.38 | 2,306.15 | 2,583.93 |
Earnings per share (EPS)
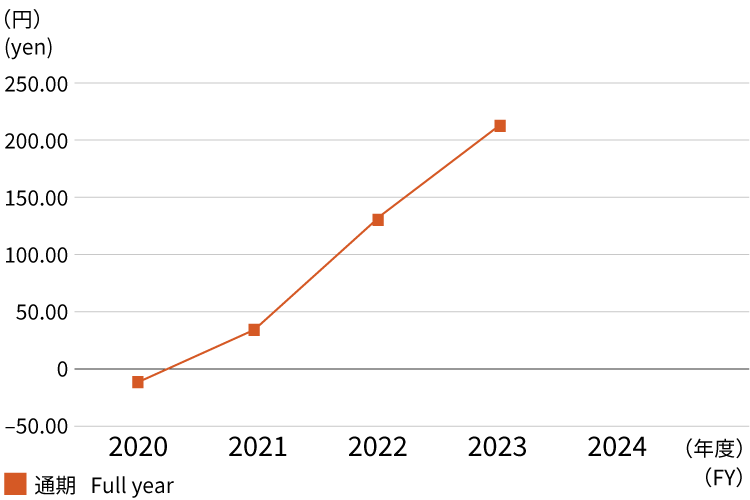
| FY2020 | FY2021 | FY2022 | FY2023 | FY2024 | |
| Full Year | -16.44 | 35.51 | 129.13 | 211.31 |
Price Earnings Ratio
Price earnings ratio
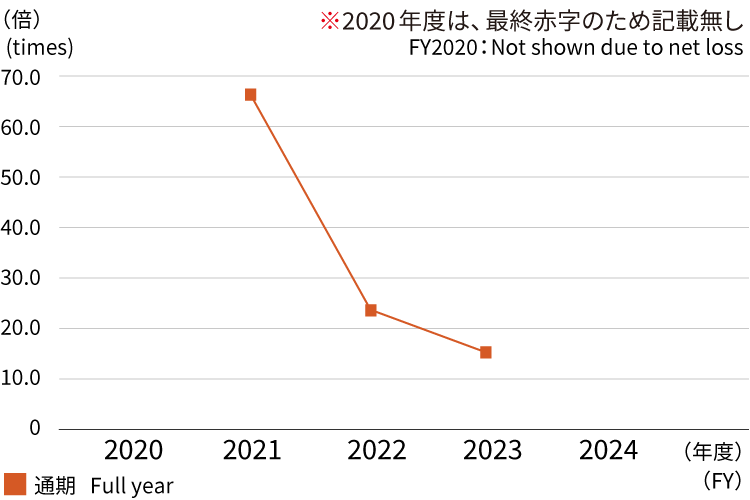
| FY2020 | FY2021 | FY2022 | FY2023 | FY2024 | |
| Full Year | - | 66.5 | 22.7 | 15.1 |